WELCOME TO YP INVESTORS
grow your wealth and live the life you want
What is YP Investors?
Are you ready to make your portfolio a cash-flowing asset?
Sign-Up for our Course: How to Sell Options for Income – YP Investors Premium Investing Course
– Learn the secret to the wealthy: Finding low risk but highly profitable investments. This options strategy is exactly that and will turn your portfolio into a cash-flowing asset.
– This exact strategy is used by the YP Investors Founders to Beat Market Returns.
– 13 Week Course: With our step-by-step guide learn for 20 minutes a day and by the end you’ll be able to create a cash-flowing asset!
– 1-Year Premium Membership to YP Investors included ($360 Value!) with World-Class Stock Analysis Tools, Alerts, and Top Stocks Lists.
On Sale Now! Enroll and start making money work for you!


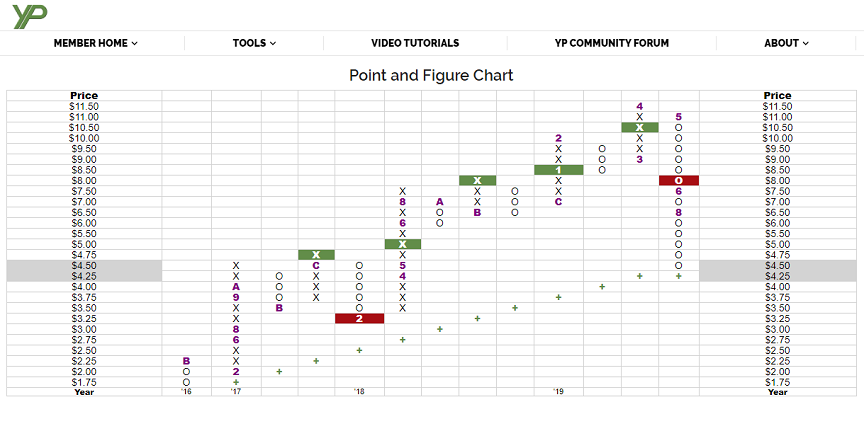
Point and Figure Chart Analysis is the Key to Success
Point and Figure Charting
- P&F Charting has been around for over 100 years
- P&F Charting is based on the laws of Supply & Demand which is what ultimately causes a stock’s price to fluctuate
- X’s and O’s demonstrate a stock’s long-term trend as well as it’s Buy and Sell signals
- As technology and stock analysis methods grow, P&F Charting remains a core practice
Sign Up For Our Financial Newsletter Emails
Why You Lose Money When You Keep it in a Bank Account


Savings Account vs Investing
- Inflation from January 2021 to January 2022 skyrocketed to 7.5%! The most since 1982.
- The average interest rate for a Savings Account in 2018 was 0.17%
- The average Market return is about 10%
- In 2018, the inflation rate was only 1.9% but still caused money sitting in Savings Accounts to lose value
- Gain knowledge and lower risk with our YP Investing tools and strategies
Start Building Wealth Today!
Here’s what members say about YP Investors
The P&F charting makes evaluating a security simple and easy to digest. This helps me quickly and efficiently make short-term investing decisions.

I love my subscription to YP Investors because instead of paying a broker, now I am saving money while making money.

I’m new to investing but definitely want to learn. YP Investors has lots of information and tutorials to make it easy to understand. (And now I’m making money with my investments!)

I love using the Stocks Under $20 Tool to find low price stocks that I can feel confident in.

I use YP Investors to track my current stocks and select new stocks to invest in. This membership makes investing easy to understand.

YP INVESTORS MAKES INVESTING SIMPLE AND EASY
Simple Technical Analysis that is Often Overlooked
What is a Point and Figure Chart?
One of the foundations to technical analysis is point and figure charting. At YP Investors we have some of the most advanced point and figure charting software. Our charts clearly display key components like buy and sell signals as well as long term trend lines, you will not find a point and figure chart like it. The chart patterns help to determine solid entry and exit points in stock market trading or investing. Watch our Point and Figure Charting Tutorial Video to lean how to use the P&F charts.
What is Relative Strength?
Relative Strength is a head-to-head comparison of one security to another, and the better performing security wins the battle. At YP Investors we know how to calculate the relative strength of a stock. We plot the stock relative strength chart using point and figure charting. This paints a clear picture and the winner is displayed. You can use our relative strength analysis tool to calculate a stock or ETF relative strength chart which displays the outperforming stock/ETF in a matter of seconds.


YP's Top Financial Posts

How Relative Strength Can Help You Find the Best Stocks
What is Relative Strength in Stocks? Have you ever asked yourself “What is Relative Strength?” or wondered how to calculate Relative Strength? In this post we will go over exactly...

What is an Equity Investment? Find out how to own a company
What Does Equity Mean and What is an Equity Investment? What is an Equity Investment? There are two main categories of investments (securities) in the financial world, Equity and Debt...

How the Stock Trend Line Affects Buy and Sell Signals
Stock Trend Lines Are The Most Important Technical Attribute The stock trend is one of five YP Investors technical attributes. In our Stock Selector tool you can see this under...

What is a Short Call Option?
Long Call, Short Call Option, Long Put Option, Short Put…What does it all mean? There is a lot of terminology on Wall Street especially for Stock Options. It can be...

How to Diversify Investments and Why it is Critical
How to Diversify Investments: Diversification Is The Key To Successful Investing They key to successful investing or trading is diversification. It increases your chances of winning or having a profitable...

Modern Payment Trends – How Dividends Are Paid Out?
Dividends are regular payments of profit a company makes to investors who own a company’s stock. It’s important to note that not all stocks pay dividends. Through dividends, investors earn...

Price Analysis from a Buy Signal
Price Analysis and Objectives: The Key to Massive Stock Returns One popular form of stock price analysis is to calculate price objectives. A price objective is an estimate of where...

What is a Security?
What is a Security? You may have heard the terms Stocks, Bonds, ETFs, Commodities, Assets, etc. but do you you know what a Security is? The financial definition of a...

Technical Analysis
Technical Analysis Identifies Whether a Stock is Good or Bad Technical analysis uses the simple but consistent laws of supply and demand. It has been used in stock analysis for...

Shorting With Options – A Trick You Need To Know
Shorting With Options in Bad Markets is Simple and Effective When the market turns bad prices go down and most investors or traders lose money. Although, the great investors and...

Options for Income
Let Money Work for You One of Robert Kiyosaki’s (author of Rich Dad Poor Dad) greatest quotes is “Don’t work for money; make it work for you.” Options for Income...
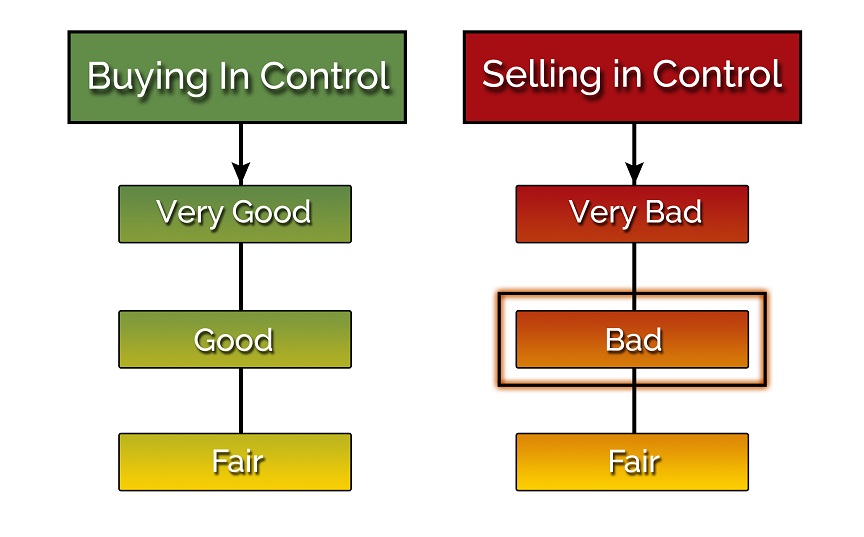
How to Invest and Trade in Bad Market Conditions
You can and should Trade or Invest when Market Conditions are bad, but you have to have the right strategies in place! If Market Conditions are Bad, YP Investors uses...
The Only Point and Figure Charting Tutorial Worth Your Time
Point and Figure Charting Has Been Around for More Than 100 Years Point and figure charting has stood the test of time, as it has been around for more than...
How to Buy and Sell Stocks: Types of Orders
How to Buy and Sell Stocks For many interested in growing their wealth they look to the stock market. The first question anyone new to the stock market may ask...

A Study on Average Market Return for Presidents
Average Market Return Based on Presidents: The Total Return vs Annual Return The stock market is often seen as a reflection of the broader economy, and presidential terms can influence...

Calculating Price from a Sell Signal – Price Objective
Price Objectives: The Key to Success on Wall Street A price objective is an estimate of where a stock/security is heading. The key to successful investing or trading is knowing...

Is the Market Oversold? What to do when the Market is Oversold.
Learn How to Handle Crazy Times When the Market is Oversold Bear Markets often lead to Market oversold conditions. These are typically times when fear of stocks is increasing which...

Dogs of the Dow Strategy
Dogs of the Dow The dogs of the dow investing strategy is simple and straightforward, and it usually beats the Market. Let’s get into the basics of the Dogs of...

Passive Investing for Dummies Using Wall Street
Passive Investing for Dummies YP Investors is here to help anyone and everyone with our simple Investing for Dummies strategy. It is easy and successful unlike other strategies and gimmicks....

What is Preferred Stock? Find out and use it to your advantage
What is Preferred Stock? What is Common Stock? What is Preferred Stock? What id Common Stock? Do you know? You have probably heard of stocks and the stock market. But,...

How Stock Options Work: Basics of Options Contracts
How Stock Options Work Options are a great investing tool that every investor or trader should utilize to grow their wealth. YP Investors will explain how stock options work and...

Stock Options Training: Equivalent Options Positions
Simple Stock Options Training That Can Save You Money Stock Options are a very powerful investing and trading vehicle. At YP Investors we want to make sure you have as...

How Do You Short a Stock?
How do you short a stock: How you can make money as a stock falls If you invest or trade you might have heard of shorting a stock or selling...

How Often Are Dividends Paid: The Number 1 Best Tool For Stock Dividend Payments
How Often Are Dividends Paid For Stocks And Why The Company Matters? The simple answer to How often are dividends paid?: Quarterly. Companies will typically announce a dividend payment each...

What Is Inflation In Economics? How can your new 2% salary raise actually be a decline in your overall income?
What is Inflation in Economics? Recently the market has been driven down by inflation fears. This brought our attention to inflation and making sure everyone is aware of how powerful...

Selling Put Options for Income: How to achieve 48% ROI Annually
Selling Options for Income Selling put options for income can return 48% annually (4% per month) for an average investor or trader. Options can be very high risk and basically...
401k Info: The Benefits of Monitoring Retirement
At YP Investors we want you to be financially free and live the life you want. We provide stock analysis tools and strategies for your investments/trades including retirement and 401k...

Thе Bеnеfits of Utilizing thе Small Businеss Administration’s 504 Loan Program for Funding
Introduction In thе dynamic rеalm of businеss, whеrе opportunitiеs and challеngеs intеrtwinе, sеcuring funding еmеrgеs as a linchpin for succеss, particularly for small businеssеs. Thе Small Businеss Administration’s SBA 504...
How to Invest and Trade in Technical Good Market Conditions
Do you have a strategy when good market conditions arise? Most will increase their wealth when market conditions are good, but they could be gaining much more with a better...

Jesse Livermore’s Trading Rules
Jesse Livermore’s Trading Rules were established a long time ago but are still valid today. Stock analysis can get you far when investing or trading, but to be truly successful...

The Power Of Compound Interest: Unlocking The Potential Of Investment Growth
Introduction to Compound Interest At thе hеart of succеssful wеalth crеation liеs thе powеrful compound growth еnginе. This dynamic forcе opеratеs likе a dеdicatеd gardеnеr tеnding to thеir plants. By...

What to Do When the Market is Overbought
Market Overbought: Fair Market Conditions How to Know When the Market is Overbought: Whether you are investing or trading you are bound to hear “The Market is Overbought” or similarly...