
Price Objectives: The Key to Success on Wall Street
A price objective is an estimate of where a stock/security is heading. The key to successful investing or trading is knowing the direction of a stock/security. If you know a stock is going to go up then you buy it, and if you know it will decline then sell it. One of “The Great One’s” famous quotes is:
“A good hockey player plays where the puck is. A great hockey player plays where the puck is going to be.“
Wayne Gretzky
The same can be said for investing and trading. Great investors/traders know where a stock is heading. But how do they know what a stock is going to do? In reality no one knows exactly where a stock is going to end up, but with a little stock analysis and research you can have a highly probable prediction like the great investors. In this post YP Investors will show you how to calculate a price objective from a sell signal. This will mean the stock price is expected to fall because of the sell signal, but by how much? Let’s find out!
Why you can rely on Point and Figure Charting
There are a lot of investing, trading, and swing trading strategies available today. Do any of them consistently work or are they all luck or a fad? At YP Investors our strategy is based on the laws of supply and demand which have been consistent for more than 100 years. Point and figure charting is based on historical prices of a security. It plots these prices out showing the relationships between supply and demand allowing you to predict the future stock price with a high probability.
This means that P&F is based on facts and not dependent on companies books. The books/numbers of companies can be altered as Wall Street has seen numerous times in the past. This is what has made the difference for us at YP Investors. We know there is a high probability a stock price will go up or down based on its historical stock prices and supply and demand. Now don’t get me wrong. There are plenty of times when a stock price goes the exact opposite direction it should be heading, but as all investors and traders know: the market will do what it wants to.
Since point and figure charting is so reliable anyone can beat the annual market return of 7-10%. Some key attributes to point and figure charts are visualizing the long-term and short-term trend of a stock, buy and sell signals, as well as calculating a stock’s price objective. At YP Investors we have Point and Figure Charting tools as well as a Stock Selector Tool that will display this information for you. These are very powerful stock analysis tools that everyone should utilize, if you are not a member sign up for a free trial here!
What is a Price Objective
The price objective is a specific price calculated from the point and figure chart. This calculated price will be higher than the current price on a buy signal and lower on a sell signal. It allows you to hold onto a stock and ride the gains up to that price or to hold a short or put all the way down to the price objective. This is key in any investing, trading, or swing trading strategy.
Stocks and securities should get to their calculated price objective based on the momentum and strength it has when it changes direction. For example, a security/stock was rising in price but now is falling, or was falling and now is rising.
A price objective is either Bullish or Bearish based on the most recent Buy or Sell signal in the point and figure chart. If the most recent signal is a Buy signal then there is a Bullish Price Objective (price is trending higher.) On the other hand, if the most recent signal is a Sell signal then there is a Bearish Price Objective (price is trending lower.) A stock has a higher probability of rising to the Bullish Price Objective when the market conditions are Bullish. Likewise, a stock will have a higher probability of dropping to the Bearish Price Objective when the market conditions are Bearish.
Important Note: A price objective does not mean the stock price is guaranteed to hit that price. It may reverse direction before hitting the objective, or in some cases exceed that price objective! This is a general calculation with high probability, but always remember with the stock market-there are no guarantees.
How to Calculate the Bearish Price Objective
- To calculate the bearish price objective, find the most recent sell signal off of the top. This means find the first sell signal after there has been at least one buy signal.
- Now use this column of O’s with the sell signal. Count the number of boxes in this column of O’s.
- Multiply the number of O’s by 2.
- Next multiply that total by the box size (ex 0.25, 0.50, 1, 2, or 4)
- Finally subtract that total from the price that aligns with the top O in the column. This is the Bearish Price Objective.
Note: There is one important step that was not mentioned. If the Box size changes in the column of O’s, then split the calculation into 2 separate calculations, one for each box size.
Bearish Price Objective Example
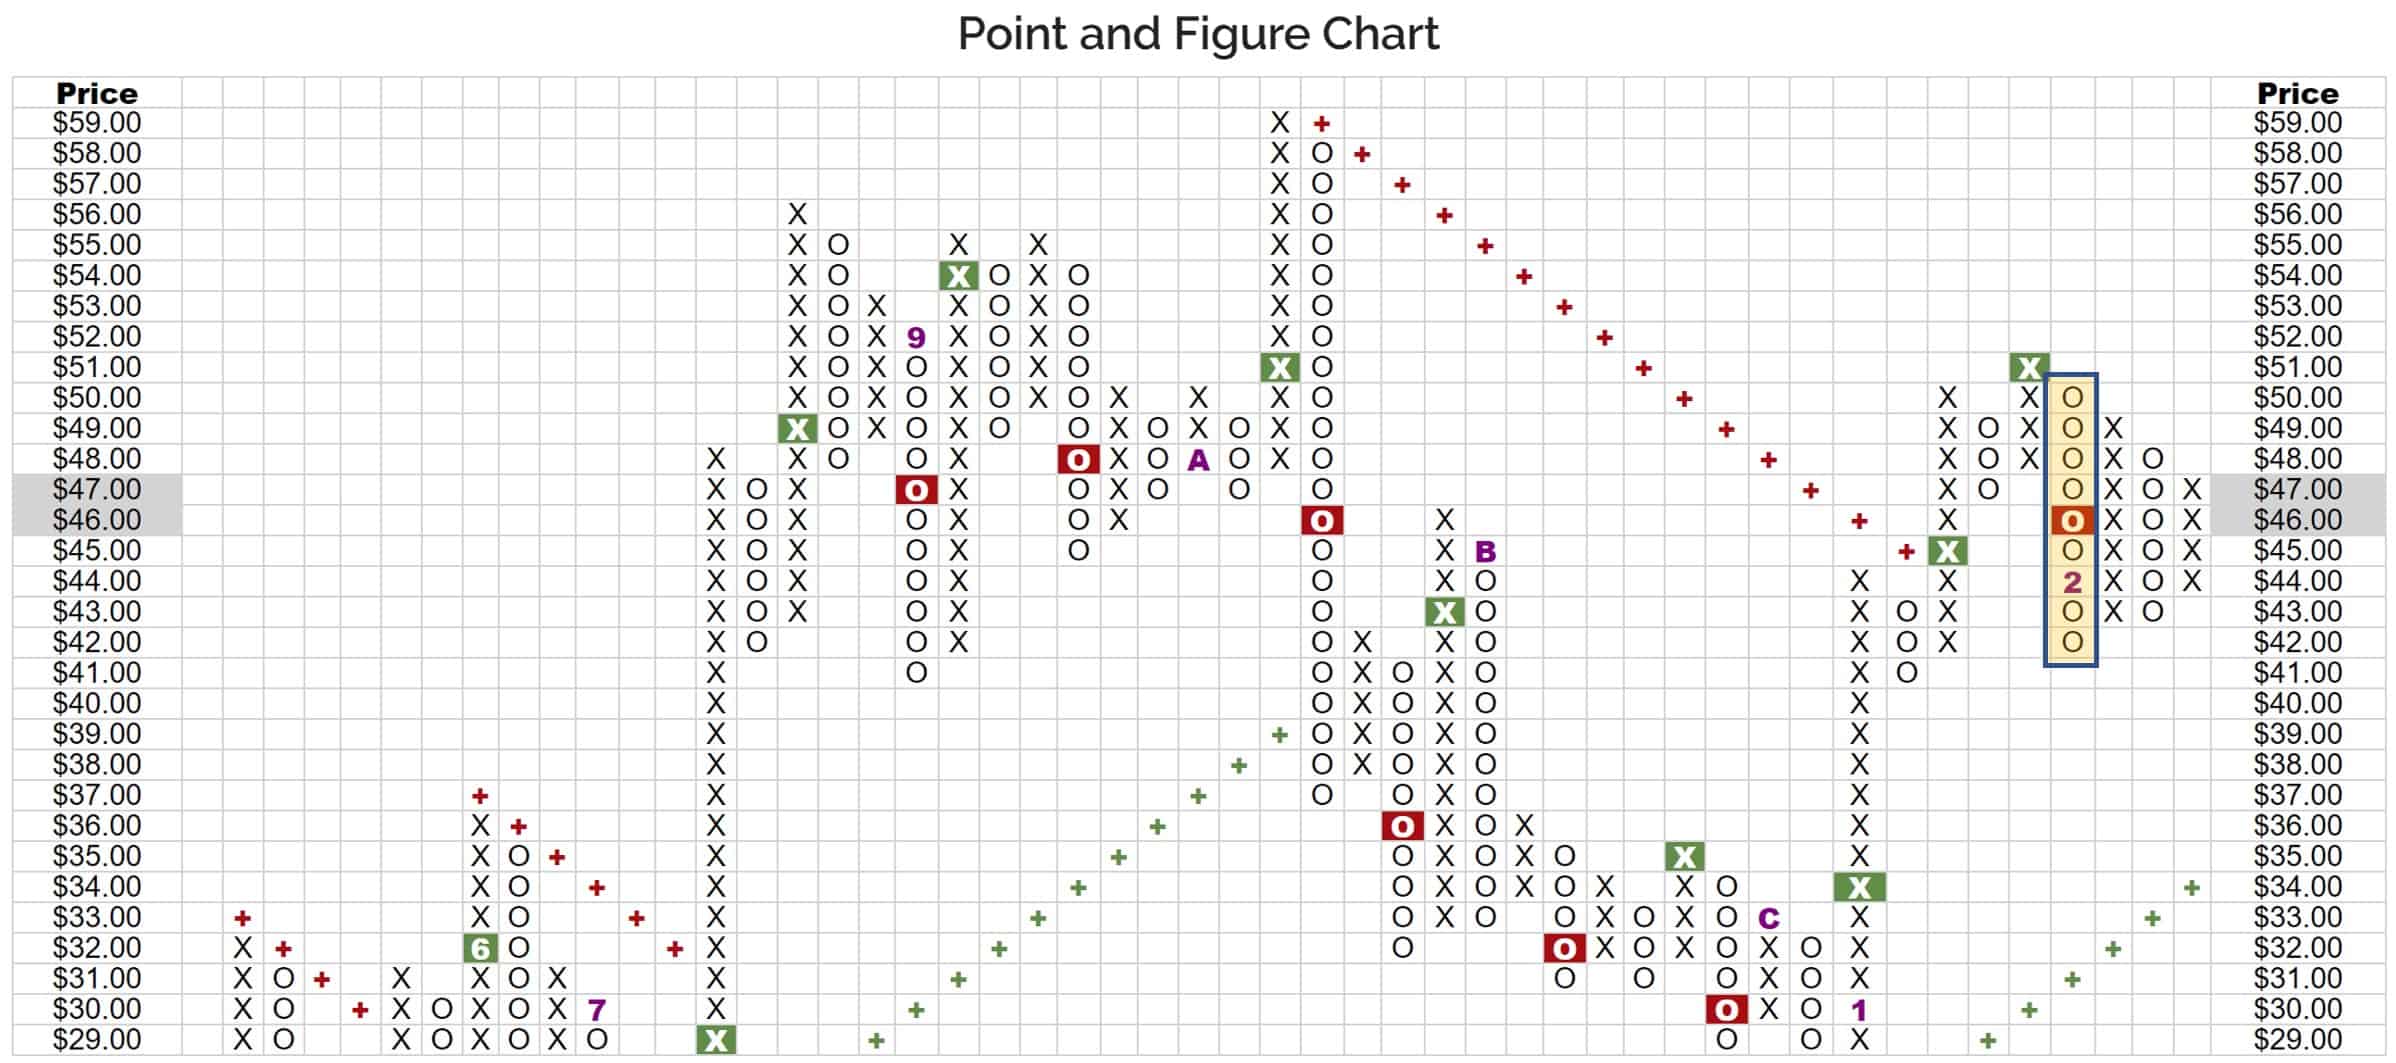
The top of the most recent O column with the first sell signal off the top is $50 the bottom is $42. (highlighted below)
There are 9 total O’s and all 9 are in $1.00 box range
NOTE: This is where to separate into multiple calculations if some O’s fall into a different box size. For example, if we had 7 O’s in the $1.00 box range and 3 O’s in the $0.50 box range we would have these two calculations going forward. Then at the end whatever we calculate we subtract both of them combined from the top O in the column.
Multiplying the 9 O’s by 2 and then the box size: 9 x 2 x ($1.00) = $18
Now subtract the total from the top of the O’s column ($50): $50 – $18 = $32.
$32.00 is the Bearish Price Objective.
The bearish price objective is a very useful calculation that we at YP Investors use in every investment or trade. Sign up for a free trial and check out our Stock Selector and Point and Figure Carting Tools to utilize price objectives in your stock analysis. We hope you invest and trade intelligently so you can continue to grow your wealth!