
What is Relative Strength in Stocks?
Have you ever asked yourself “What is Relative Strength?” or wondered how to calculate Relative Strength? In this post we will go over exactly what it is, how it works, and how to use it to your benefit. At YP Investors we offer a Relative Strength Tool and we use it as a key component in our stock analysis and selection.
So, what is Relative Strength (RS)? It is a head-to-head comparison of two securities. Note: A security can be a stock, bond, ETF or likewise. Whichever security is performing better is declared the winner during the head-to-head comparison. An easy way to visualize Relative Strength is to picture a tug-of-war. Each side represents a security, and in the end the stronger security wins the relative strength battle.
How to Become a Successful Investor or Trader
How can Relative Strength help you? You are probably reading this so that you can be a successful investor or trader. The basic definition of a successful investor can be boiled down to this idea: that their winning investments outweigh their losing investments.
With our YP Relative Strength Tool you are able to compare your securities to others that you may be interested in or compare your security to the overall market. You’ll now be able to analyze your investments to avoid the big losers and keep the winners. One step towards labeling yourself a successful investor!
For example, you can compare stocks like Facebook and Amazon, and our YP RS tool will show you which security is outperforming the other. You can do the same for a stock like Google versus the Market and you will know whether it is better to invest in Google or the Market. Our Relative Strength tool not only encompasses stocks, but it also can perform ETF Relative Strength. You can compare a stock like Exxon versus an energy sector ETF and find out which is the better performer in a matter of seconds!
Using Relative Strength to Find the Top Performers
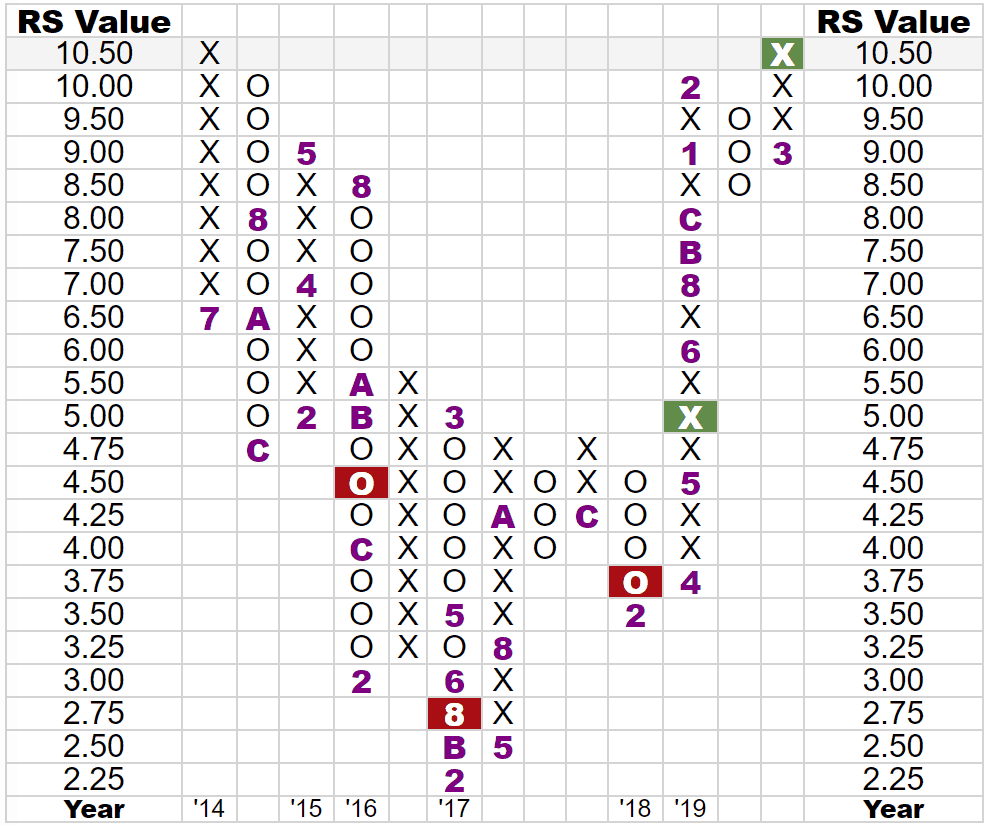
Now that we know the importance of relative strength, let’s go over how to use it. Our YP Relative Strength Chart is plotted using Point and Figure Charting. Check out the YP Investors Point and Figure Charting Tutorial Video to learn more about our YP point and figure charts.
The Relative Strength chart contains X’s and O’s, and buy and sell signals. Unlike a classic Point and Figure chart, there are no trend lines and the chart patterns do not matter for this chart. All that is important to us is the current column and latest signal. The current column is the column found furthest to the right. The latest signal is either a red box, indicating a sell signal or a green box, indicating a buy signal. The latest signal being the red or green box that is in or closest to the current column. These two factors help to determine the short-term and long-term winners in these head-to-head comparisons.
Lucky for you, with our YP Investor tools you don’t have to know how to perform relative strength calculations. Let our tools do that hard work and analysis for you. Enter the desired match-up and our tool will automatically display the short term and long-term winner!
Comparing Stocks/ETFs vs The Market
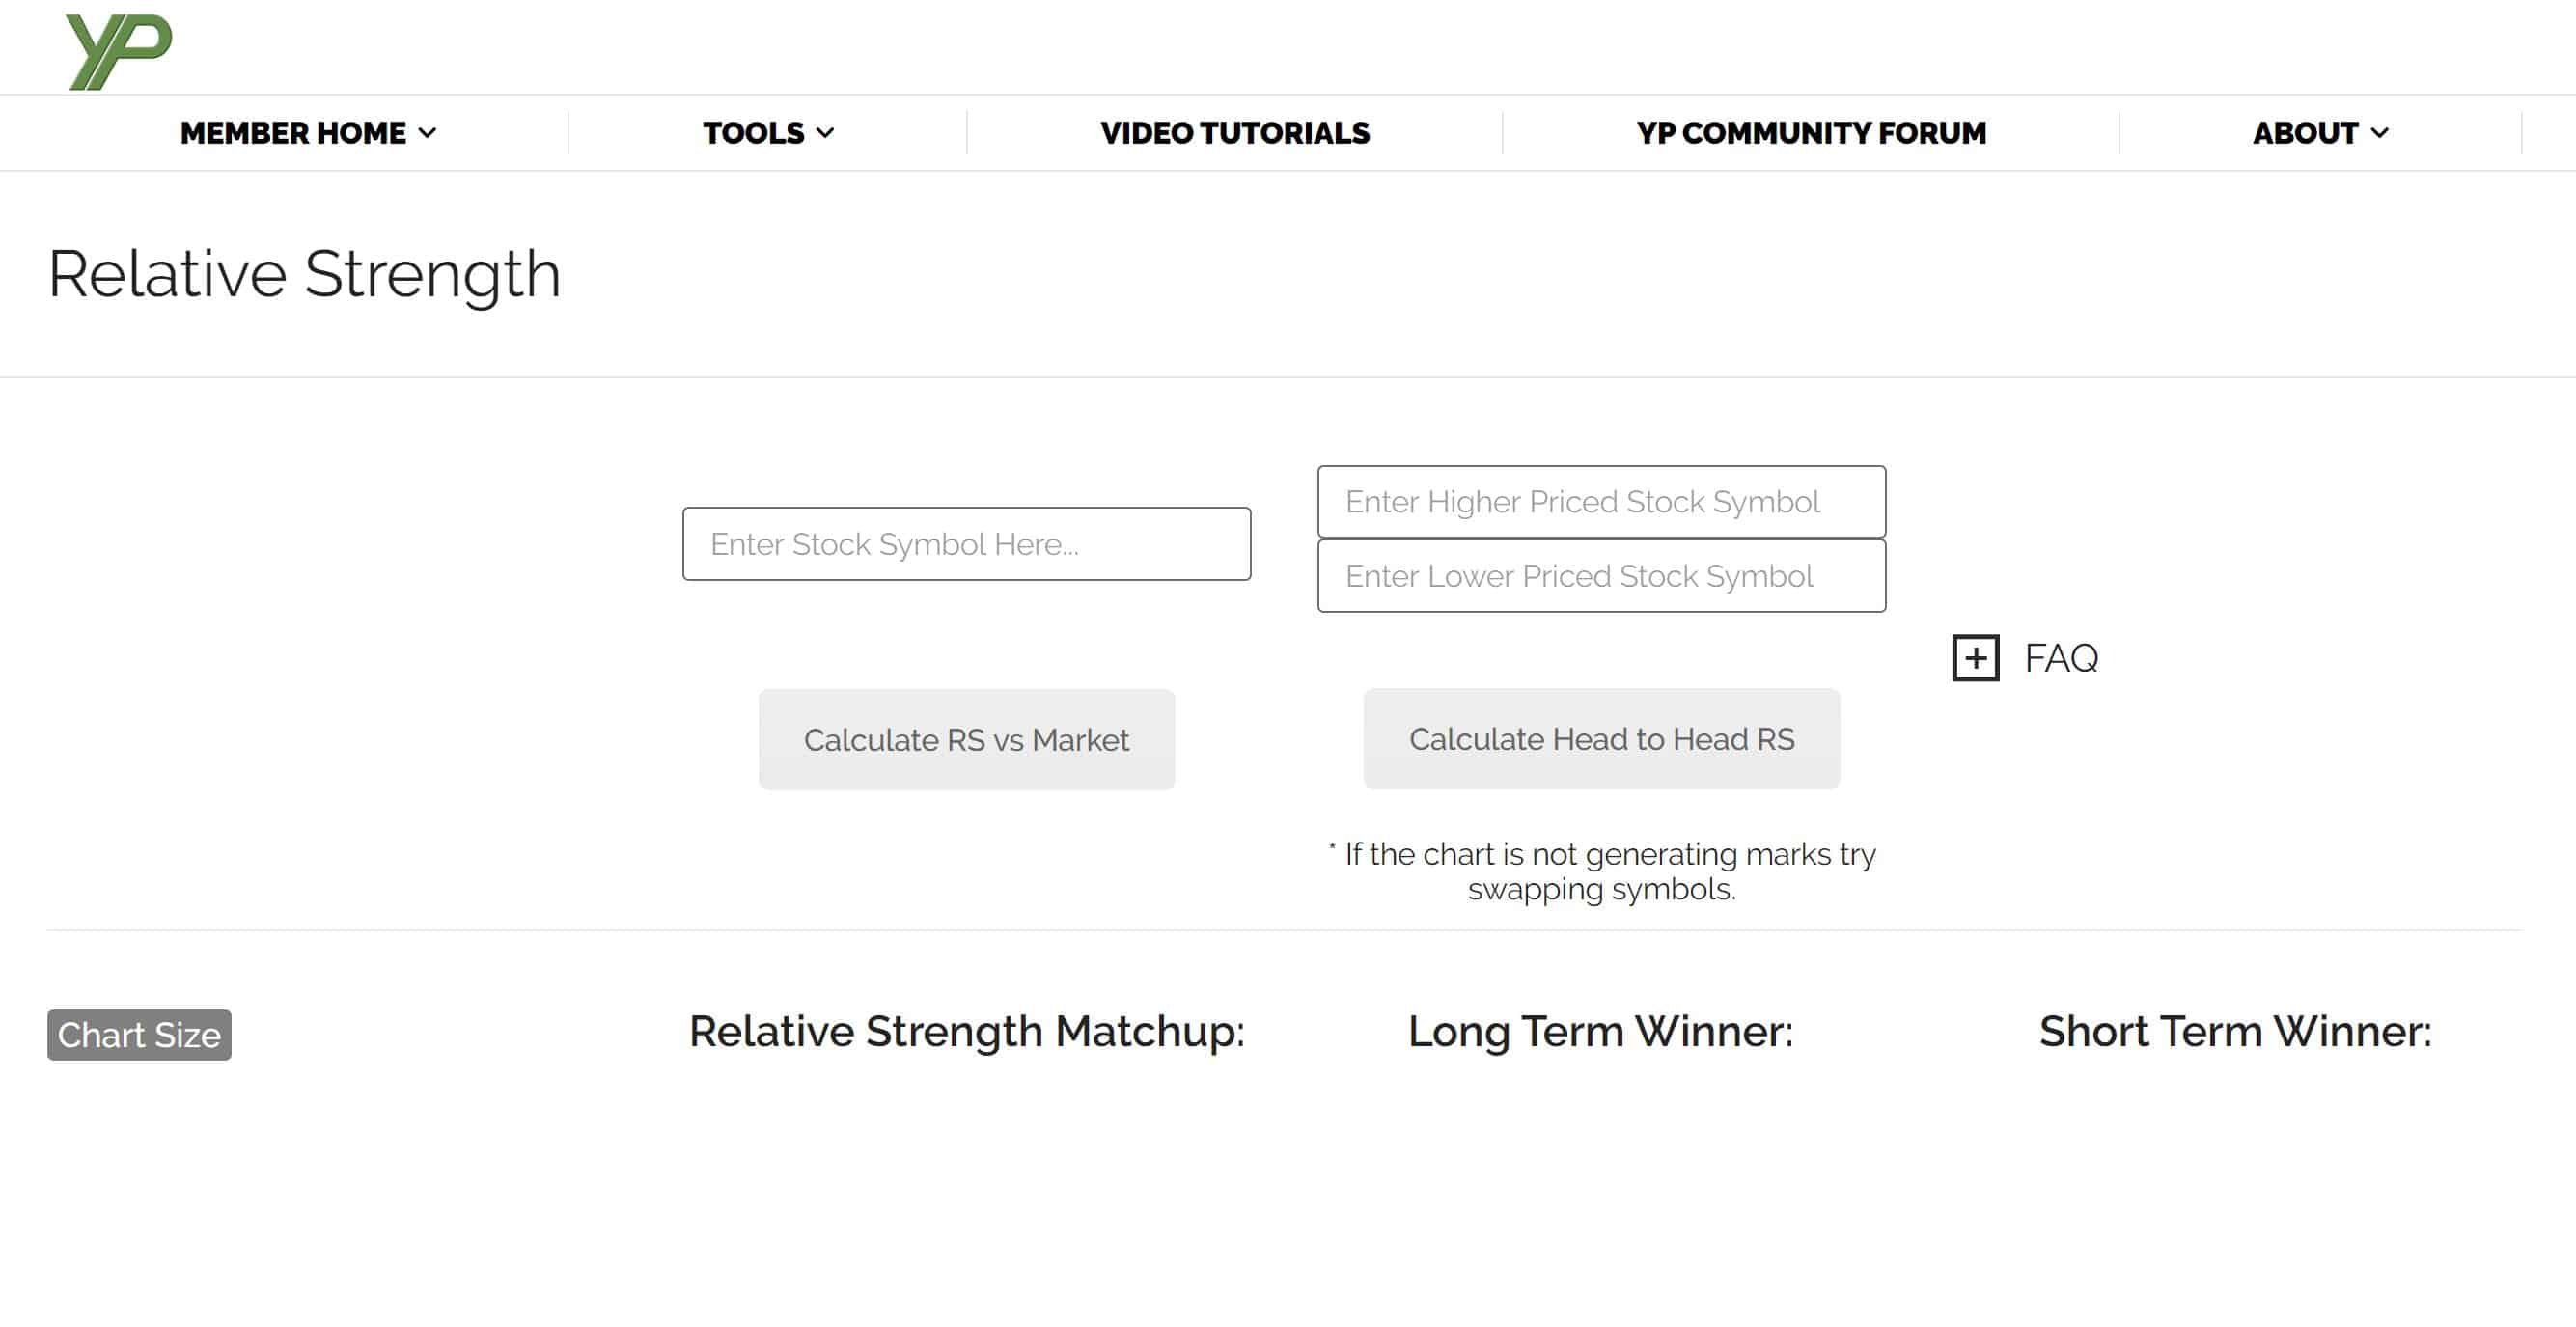
Let’s take a closer look at the YP Investors Relative Strength charting tool. Starting at the top of the page you’ll see two different calculation options. The box on the left is a head-to-head comparison with the market and the two boxes on the right are a head-to-head comparison of two securities.
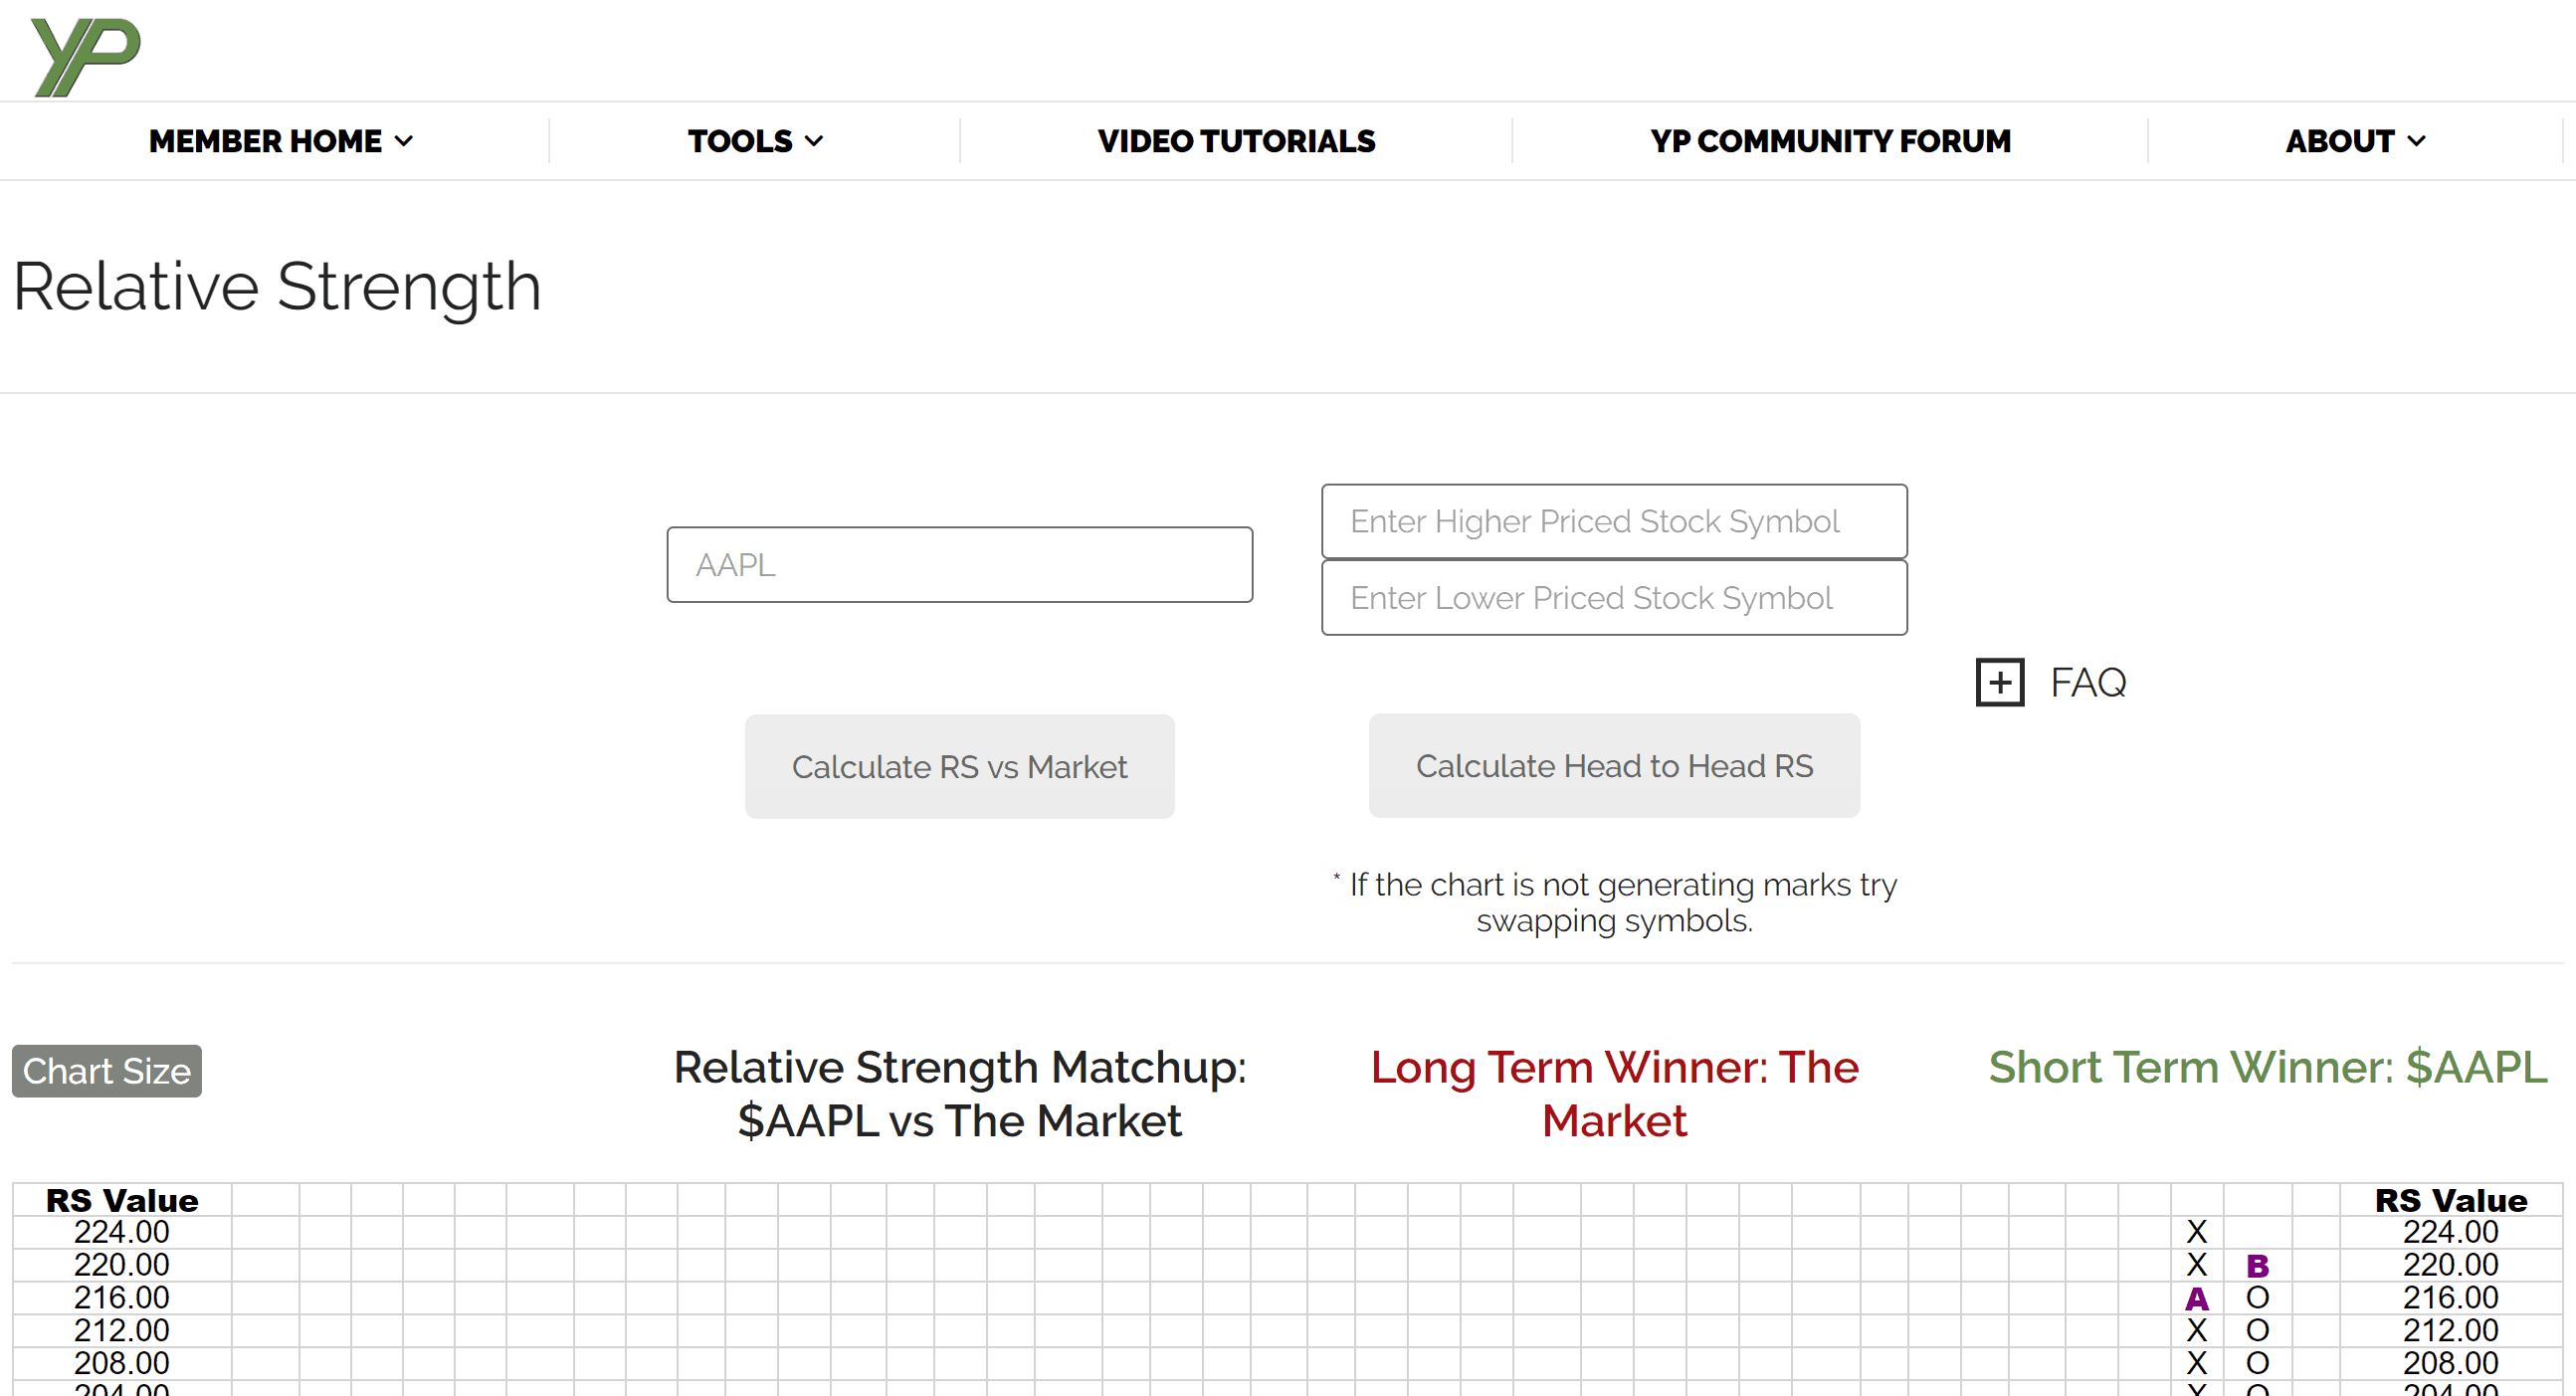
First, when comparing a security to the Market, click the “Calculate RS vs market” button. The “Market” is an equal weighted portfolio of the S&P 500, giving us a great representation of the stock market overall. Once you compare the security you are analyzing against the market you will have a clear picture of just how strong that security is versus the stocks in the market. Notice (in the image below) that the long term and short-term winners are displayed in either red or green. Red means losing and green means winning. Below these results you’ll see a chart for additional analysis.
Comparing Stocks/ETFs Head to Head
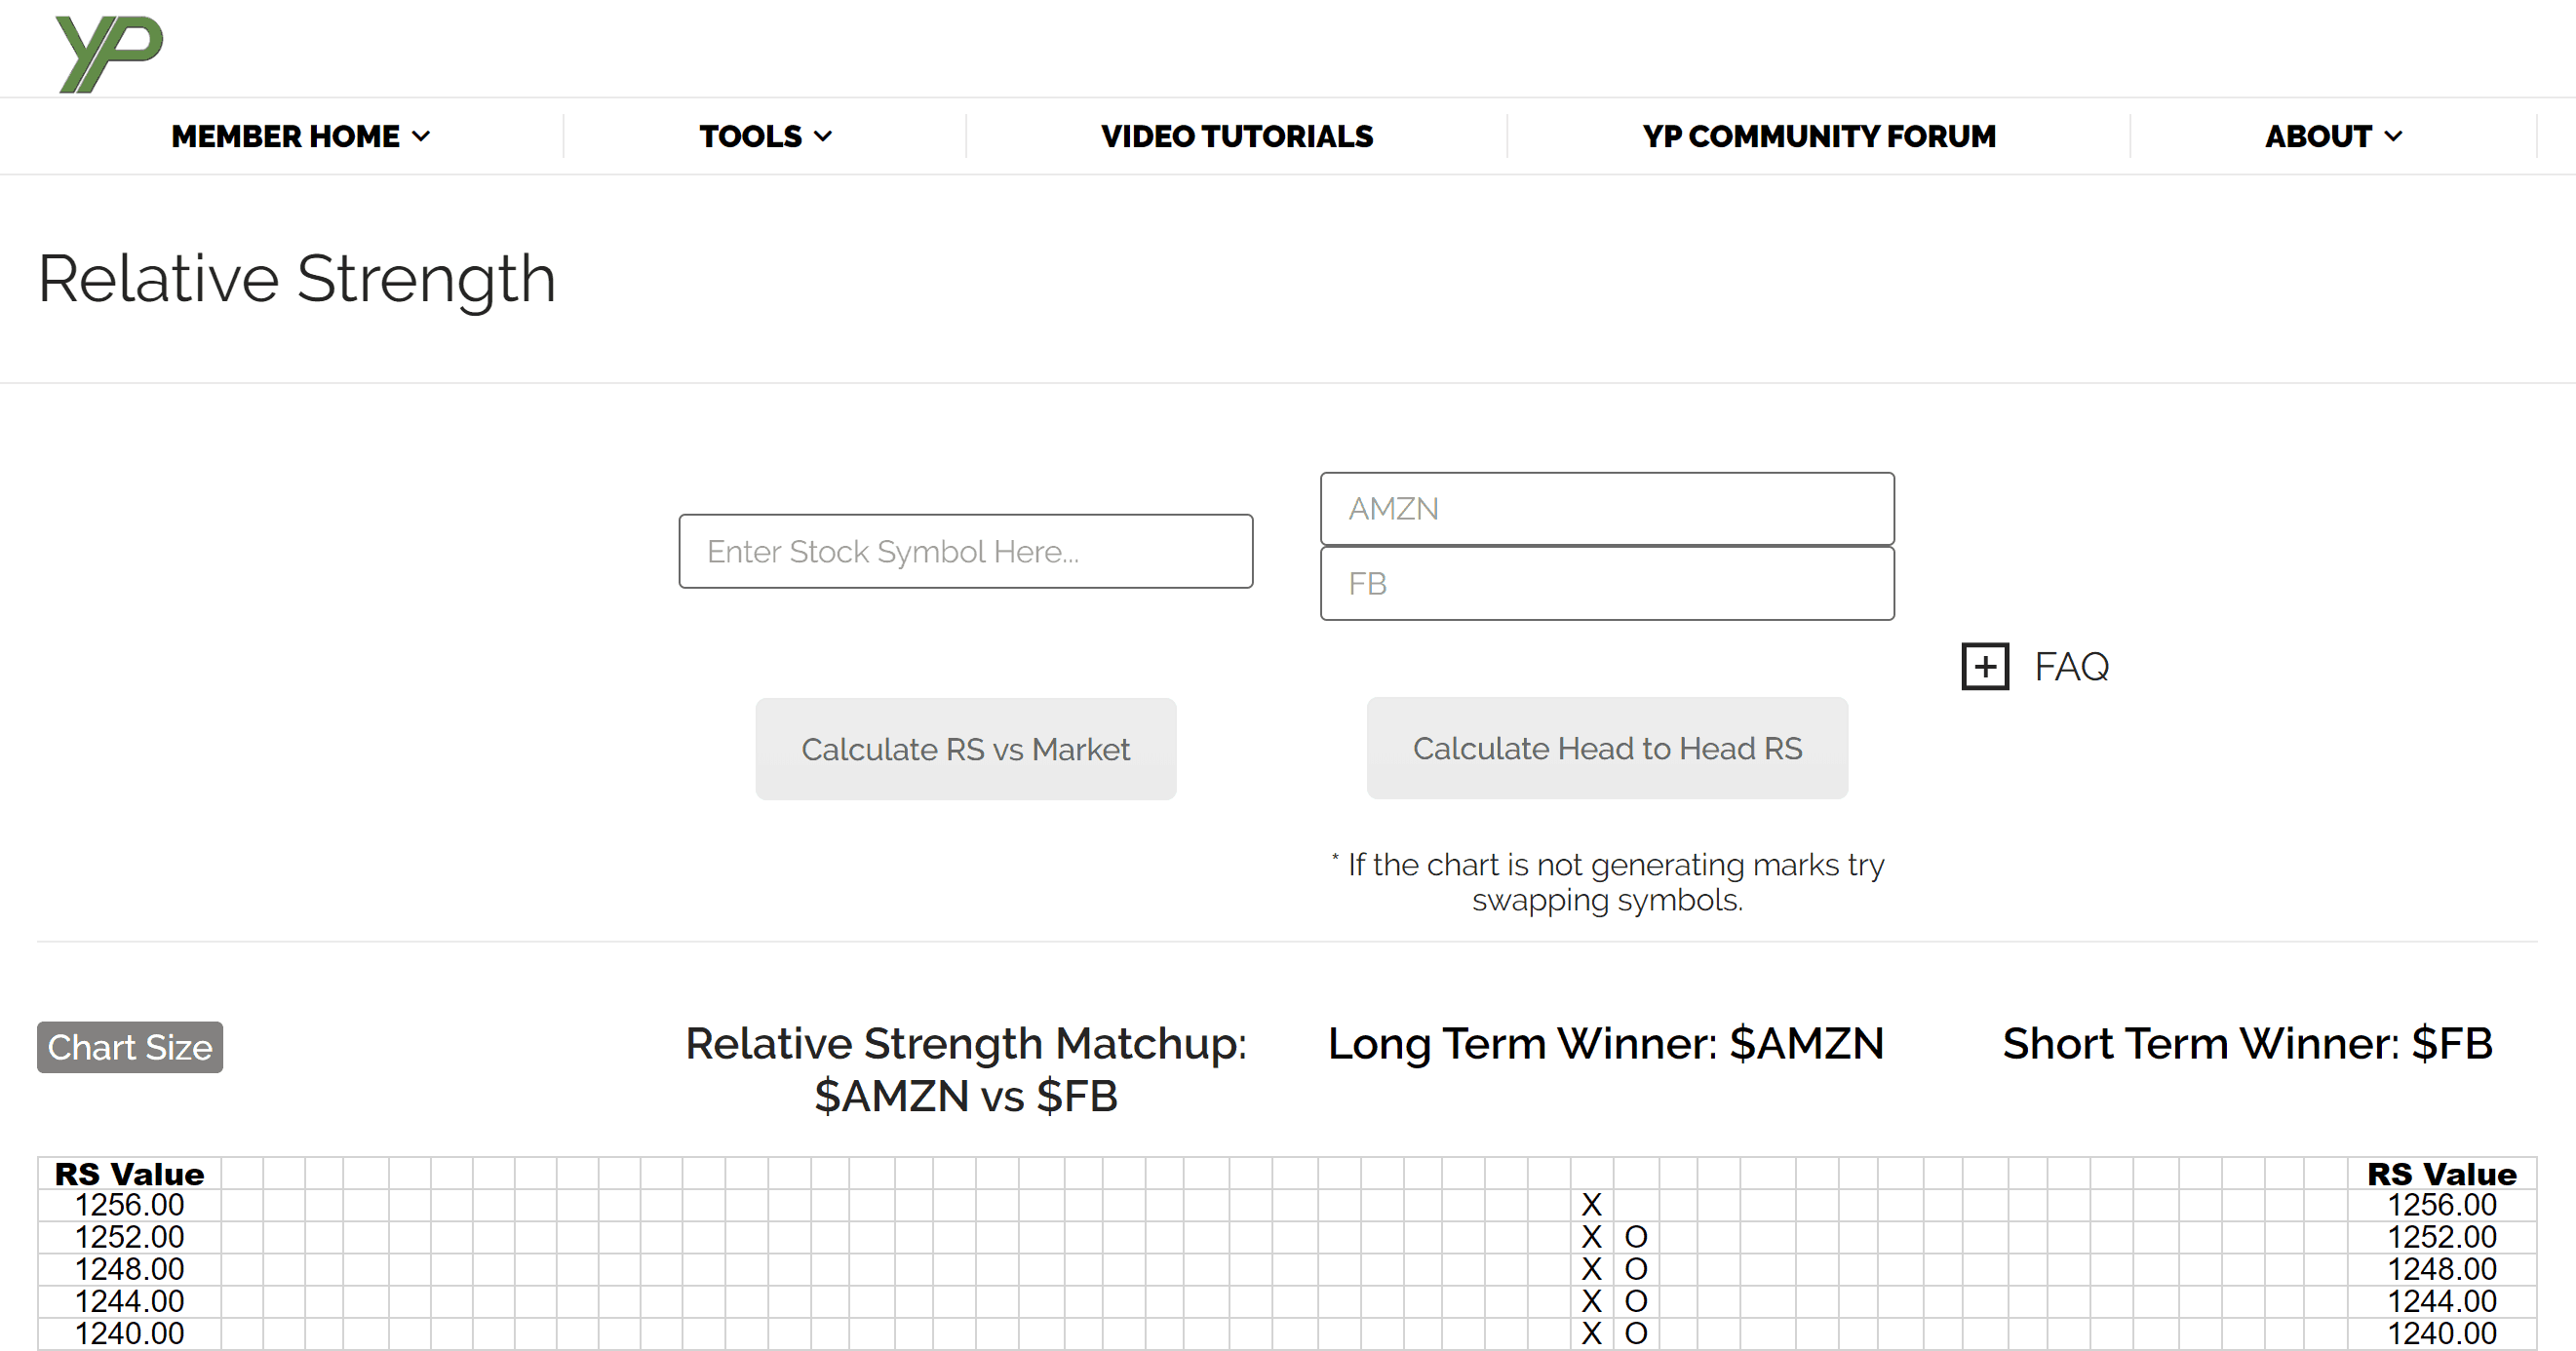
Returning to the top of YP Investors RS tool, you’ll see two boxes on the right. These boxes are used for head-to-head comparisons of two securities. Whether you are interested in comparing stocks or ETFs or both, you can enter them into the fields shown. Click the calculate head-to-head RS button and the short term and long-term winners will be displayed.
One important thing to note about Relative Strength charting is that you’re only comparing one security to another and finding the stronger one. This does not mean the stronger security will go up in price, it means that the stronger one is performing better than the losing one.
The security that wins both short-term and long-term RS battles, is the most desirable. The security that loses both short-term and long-term is the least desirable. This tool can help you find and hold onto winning stocks on your road to becoming a successful investor.
Grow your Wealth to Live the Life you Want!
YP Investors Relative Strength tool is one of our most powerful tools offered to members. It is a key component to successful investing and trading, and ultimately it will help you grow your wealth.
We also have our YP Investors Relative Strength Tutorial Video. This tutorial video provides an easy way to learn and understand relative strength. We highly recommend you check it out and don’t forget to check out all YP Investors videos on our Video Tutorial Page.
The key takeaway we want you to remember is to be an intelligent investor/trader. If you invest or trade at all in the stock market then relative strength analysis should be a implemented in your strategy. This will allow you to get the strong and best performing securities, so you can grow your wealth and live the life you want!
Don’t forget to check out everything we have to offer at YP Investors, including our video tutorials, analysis tools, and community forum. Sign up for a free trial membership today!