
Technical Analysis Identifies Whether a Stock is Good or Bad
Technical analysis uses the simple but consistent laws of supply and demand. It has been used in stock analysis for over 100 years. As new stock analysis trends come and go, Technical Analysis remains a constant. Using the price history of a stock it can’t be distorted like many company books have been in the past. Inaccurate books mask fundamental analysis to look great until the truth is finally revealed often leading to bankruptcy.
Holding a stock to bankruptcy is a painful and frustrating experience. You should never have to go through this if you employ technical analysis properly. There are 5 key Technical Analysis Attributes that identify the health of a stock/ETF. All five of these attributes utilize point and figure charting.
Point and Figure Charting is the Hidden Secret to Finding Great Stocks
Point and figure charting is based on historical prices of a security. It plots these prices out showing a clear picture of the supply and demand in a stock. This allows you to predict the future stock price with a high probability.
Point and figure charting is based on facts and not dependent on companies books. With it we know there is a high probability a stock price will go up or down based on its historical stock prices and supply and demand. Now don’t get me wrong. There are plenty of times when a stock price goes the exact opposite direction it should be heading, but the Market is not 100% predictable or it would not exist.
Since point and figure charting is so reliable anyone properly utilizing it can beat the annual market return of 7-10%. Some key attributes to point and figure charts are visualizing the long-term and short-term trend of a stock, buy and sell signals, as well as calculating a stock’s price objective. At YP Investors we have Point and Figure Charting tools as well as a Stock Selector Tool that will display this information for you. These are very powerful stock analysis tools that everyone should utilize, if you aren’t a member sign up for a free trial here!
5 Keys to Finding Great Stocks
The best performing stocks will have the best technical attributes. There are 5 key technical analysis attributes that can separate the good/great stocks from the poor/bad stocks. This is the key to being a successful investor or trader-having more winners than losers in your portfolio.
Below are YP Investors 5 key Technical Attributes:
Note: These will be Positive for Good stocks and Negative for Bad stocks.
- Trend Line
- The long term trend of the stock. This is identified from a stocks Point and Figure Chart.
- This should be positive for any stock you own or want to purchase!
- RS vs Market Long Term
- The long term Relative Strength of the stock vs the Market. This shows whether a stock is outperforming the Market in the long term view.
- RS vs Market Short Term
- The short term Relative Strength of the stock vs the Market. This shows whether a stock is outperforming the Market in the short term view.
- RS vs Peers Long Term
- The long term Relative Strength of the stock vs its Sector. The Sector represents a stocks peers. This shows if a stock is best in class displaying if the stock is outperforming its peers in the long term view.
- RS vs Peers Short Term
- The short term Relative Strength of the stock vs its Sector. The Sector represents a stocks peers. This shows if a stock is best in class displaying if the stock is outperforming its peers in the short term view.
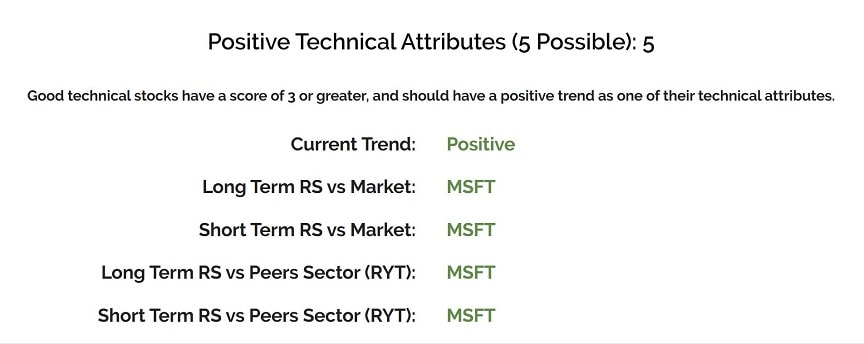
A stock that has 5/5 positive technical indicators is a technically sound stock. This means it has a high chance of rising in price. Any stock you own or plan to purchase should have a Positive Trend Line. This is the long term trend of a stock, you don’t want to own a stock that is heading down. Another general rule is any stocks you want to purchase should have at least 3 of these 5 technical indicators including positive trend line. Any stock that has 5/5 is a Great Technical Stock, but always be sure to check the current price and fundamentals as well.
Filtering Through the Crap to Find the Good
If a stock has at least 3/5 positive technical attributes including a positive trend we call it ‘Good,’ and if a stock has 5/5 we call it ‘Great.’ Meaning Good and Great from a Technical Analysis view. As a result, Good and Great stocks have a higher probability of increasing in price. Typically the more positive technical attributes the better the odds of a price increase.
By selecting stocks with at least the Good requirements you can reject the a large number of stocks available out there. This helps you to get a smaller list of good stocks. From there you can use additional Technical Analysis and Fundamental Analysis to get into solid stocks.
The really successful investors and traders find the winning stocks by having strict search criteria. In The Intelligent Investor Graham talks about how the intelligent investor will find good stocks by first rejecting stocks. If you have strict specifications you can sift through the thousands of bad and mediocre stocks available and hone in on the Good and Great stocks.
This is what YP Investors is here for. Let our Stock Selector and Fundamental Analysis Tools help you filter out the crap stocks so you can find the big winners. If you want to try them out for free, sign up for a free trial here. We hope this Technical Analysis strategy helps you be successful in growing your wealth so you can live the life you want!