Average Market Return Based on Presidents: The Total Return vs Annual Return
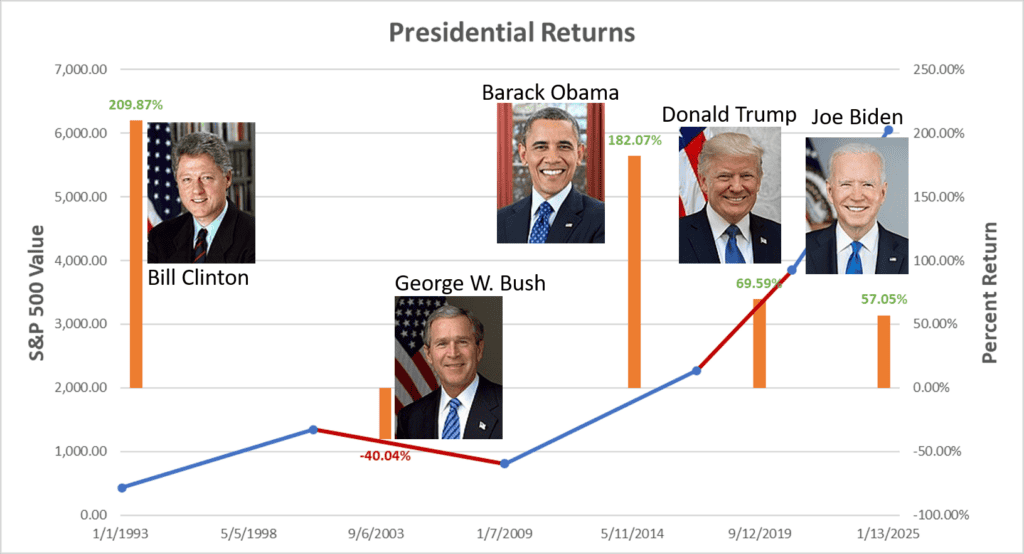
The stock market is often seen as a reflection of the broader economy, and presidential terms can influence investor confidence, fiscal policies, and overall market performance. With so much power from the president, YP Investors put together an interesting study to see how our recent presidents have influenced the market. The total return plot pictured above tells one story, but when we look at the annual return rate it tells another. Find out who has the best annual return rate in our results below!
Our results aim to give some insight on what we can expect the market to return in the near future. This study examines the average market return under different U.S. presidents over the last 35+ years, offering insights into how markets have performed during each term.
The Impact of Presidents on the Average Market Return
A common debate in financial circles is whether presidents have a direct impact on stock market performance. While markets react to many factors—global events, Federal Reserve policies, technological advancements, and economic cycles—presidential administrations can shape policies that influence investor sentiment and economic growth.
Presidential policies and actions can result in great prosperity and economic growth with high market returns, but they can also bring the economy down and causing a recession, resulting in a market decline. Next, we will take a look at our presidents and see if there is any correlation to the presidential polices or external events that occurred during their presidency.
Analyzing Market Performance by Presidency

Note we calculate annual returns with this formula:
[Annual Return = (ending value / beginning value)^(1 / number of years) – 1]
The study examines the S&P 500 Index performance during the terms of recent U.S. presidents from 1993-2024. Here are the key findings from in chronological order:
- Bill Clinton (1993-2001): The S&P 500 grew from 433.37 to 1,342.90, a 209.87% total return, with 15.19% annually.
- George W. Bush (2001-2009): The S&P 500 declined from 1,342.90 to 805.22, a -40.04% loss, with -6.19% annually.
- Barack Obama (2009-2017): The index rose from 805.22 to 2,271.31, a 182.07% gain, with 13.84% annually.
- Donald Trump (2017-2021): The market increased from 2,271.31 to 3,851.85, a 69.59% return, with 14.12% annually.
- Joe Biden (2021-2025): The market grew from 3,851.85 to 6,049.24, marking a 57.05% return, with 11.95% annually.
Annual Market Return from January 20, 1993-January 21, 2025: 8.59%
Key Observations from the Study
Overall, every President except Bush had great annual returns beating the average annual return rate over that time period.
- Why is the annual return rate different from just dividing the total return by the total years?
- When you are calculating for annual returns, you need to account for compounding! Simply dividing the total return by the total years gives a yearly average but it is not the correct value because it ignores the compounding effect.
- When you take compounding into consideration the average actually gets smaller because as you gain money over the years, that total bigger amount of money compounds and gets bigger like a snowball rolling down a hill! Therefore, less return is needed to gain more money with a bigger principal amount.
- Clinton, Trump, and Obama Eras Were Strong Bull Markets
- Both presidents saw significant stock market growth, averaging over 13% annual returns.
- Economic expansions and technological advancements (e.g., the dot-com boom under Clinton) contributed to strong performance.
- Bush Faced Market Declines
- The 2008 financial crisis had a severe negative impact on the market, leading to a -40.04% total return during his presidency, but even so one can argue that a major evet for both Bill or Barack still would have left them in the green (positive market return.
- Trump and Biden Show Moderate Growth
- Trump’s presidency saw a 14.12.7% annual return, influenced by corporate tax cuts and strong pre-pandemic growth.
- Biden’s term had 11.95% annual returns, with markets rebounding post-pandemic despite fighting high inflation concerns.
Does the President Determine Market Returns?
The Federal Reserve’s monetary policy, global trade dynamics, and technological breakthroughs all play significant roles in market movements. However, while it is crucial to understand that many external factors contribute to these market returns, the presidents do have the power and can implement policies to better react to these external events.
The data suggests that an extraordinary president can really boost the economy especially when left at the helm for two consecutive terms. Likewise, it can be challenging for some presidents to bounce back from painful external events. However, we have witnessed some able to recover during their term like Trump with the COVID-19 Pandemic.
What can we expect from the Market for Trump’s Second Term? 3 Different Predictions
The S&P 500 closed at 6,049.24 on January 21st, 2025 marking the beginning of Trump’s 2nd term and the end of Biden’s. As of February 15th, 2025, the S&P 500 was at 6,114.63. This means after 4 weeks into Trump’s second term he has a return of about 1.081%. If we extrapolate this out to an annual return, we would get a 15.0% Annual Return, based on current performance. This method of prediction has our least amount of confidence, as the classic saying goes “past performance does not indicate future results!”
However, we cannot forget about the great law of Regression to the Mean. If we look at the 32-year annual return rate have 8.59%, and if we look at the return rate for the last 16 years, starting after the Bush administration we have a 13.43% annual return rate. This 13.43% annual return rate and the annual return we calculated from Trump’s start of his second term (15%) are well above the historic S&P 500 annual return level. Therefore, if we attach 30% correlation to the current Trump return and adjust our 32-year average accordingly we get a Scientific Expected Trump 2nd Term Annual Return of 10.513% [8.59% + 30%*(15%-8.59%) = 10.513%]. This method of prediction is the most scientifically backed and has YP Investors most confidence.
Finally in a more pessimistic view, if we assume we will totally regress to the 32-year mean of 8.59% during Trump’s second term we can expect to see a drop in the S&P 500 to about 4,190 which is a -30.74% total return! This would mean Trump’s second term Annual Return Rate would be -8.77% in our most pessimistic prediction. This method of prediction has validity, as we know our historical market average over 100 years is lower than what we have witnessed in the last 16. Therefore, this is in the realm of possibility.
Note we calculate annual returns with this formula: [Annual Return = (ending value / beginning value)^(1 / number of years) – 1]
Conclusion
The study of market returns under U.S. presidents provides valuable insights into economic trends and investor confidence. However, attributing stock market performance solely to a president’s policies would be an oversimplification. Investors should consider broader economic indicators and long-term trends when evaluating market conditions like the infamous law of regression to the mean.
By analyzing past performance, we can better understand how various factors—including government policies and reactions—affect markets, helping investors make more informed decisions.
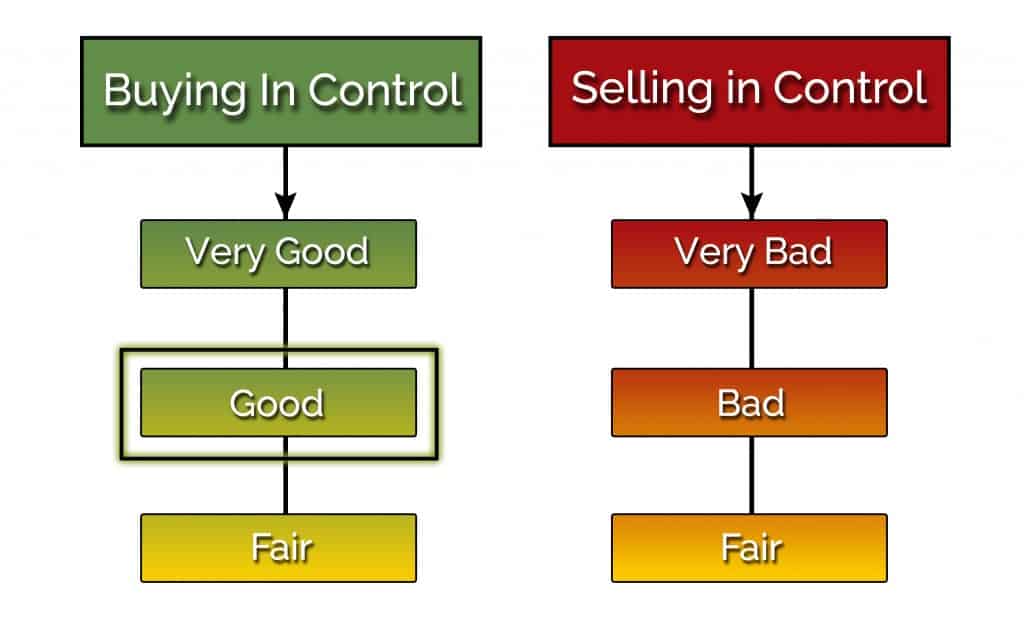
As of the publishing date of this Article (February 15th 2025) we have Good Current Market Conditions:
YP’s technical indicators suggested the Market (NYSE) Conditions are Good.
Right now, the Market has about 50.82% of Stocks on buy signals. The number of stocks on Buy Signals is right at the midpoint of the chart, but close to switching to Bad conditions. No worries if you are a member we will instantly update you on any market changes.
If you are a member of YP Investors we will automatically notify you instantly anytime the Market Conditions change (Become a Member here).

What does this mean?
NOTE: This is Not Investment Advice.
Buying has taken control in Stocks. The market is bullish and stock prices should continue to rise. The Market Conditions are Good!
Our technical indicators use the stocks in the NYSE (New York Stock Exchange) to generate the current Market conditions. Good Market Conditions means that Stocks are already in or transitioning to buy signals. For YP Investors this is a good time to invest into sound Fundamental and Technical Stocks. (Check out our updated Top Stocks and Penny Stocks Pages)
Below is a summary of what actions YP Investors Takes. Read the list of the all the scenarios and actions we take during Good Market Conditions.
Action to take on any current positions: YP Investors is holding their positions in Stock/Stock ETF Securities at this time if they are still in Positive Trends and solid Fundamentally. We are also starting to transition out of Bonds/Bond ETFs an into Stocks/Stock ETFs.
Action to take with any cash: YP Investors is planning to start the transition out of Bonds/cash into Stocks/Stock ETFs. We will be focusing on stocks with great fundamentals like our Buffett Fundamentals Tool suggests. We will also check Technical Analysis to make sure it is in a Positive Trend, and hopefully beating the Market. Remember to look for Buy Signals as a good entry point for a Stock.
