
Basic
Includes all the features of our Point and Figure Chart Tool
Standard
Brings you both Fundamental and Technical analysis tools
- Everything included from the Basic Membership
- Relatve Strength Tool
- Warren Buffett Fundamentals Tool, invest like Billionaire Buffett
Premium
The complete package for all your investing and trading needs
- Everything included from the Standard Membership
- Market and Sector Alerts
- Stock Selector Tool, Stock Picks, Sector Rankings, Bond Rankings
Significantly Better Value than Competitors!
The competitor prices are taken from Nasdaq Dorsey Wright Technical Analysis pricing.
I use YP Investors to track my current stocks and select new stocks to invest in. This membership makes investing easy to understand.

The P&F charting makes evaluating a security simple and easy to digest. This helps me quickly and efficiently make short-term investing decisions.

I love my subscription to YP Investors because instead of paying a broker, now I am saving money while making money.

I’m new to investing but definitely want to learn. YP Investors has lots of information and tutorials to make it easy to understand. (And now I’m making money with my investments!)

I love using the Stocks Under $20 Tool to find low price stocks that I can feel confident in.

Point and Figure Charts are the Key to Success!
What are Point and Figure Charts?
- P&F Charting has been around for over 100 years
- P&F Charting is based on the laws of Supply & Demand which is what ultimately causes a stock’s price to fluctuate
- X’s and O’s demonstrate a stock’s long-term trend as well as it’s Buy and Sell signals
- As technology and stock analysis methods grow, P&F Charting remains a core practice
- Learn why ours are the best and check out our membership options! 👇
Become a YP Member and Start Utilizing our Powerful Point and Figure Charts
Basic
Includes all the features of our Point and Figure Chart Tool
Standard
Brings you both Fundamental and Technical analysis tools
Premium
The complete package for all your investing and trading needs
Why are Our Point and Figure Charts the Best?
Point and Figure Charts: Simple Technical Analysis that is Often Overlooked
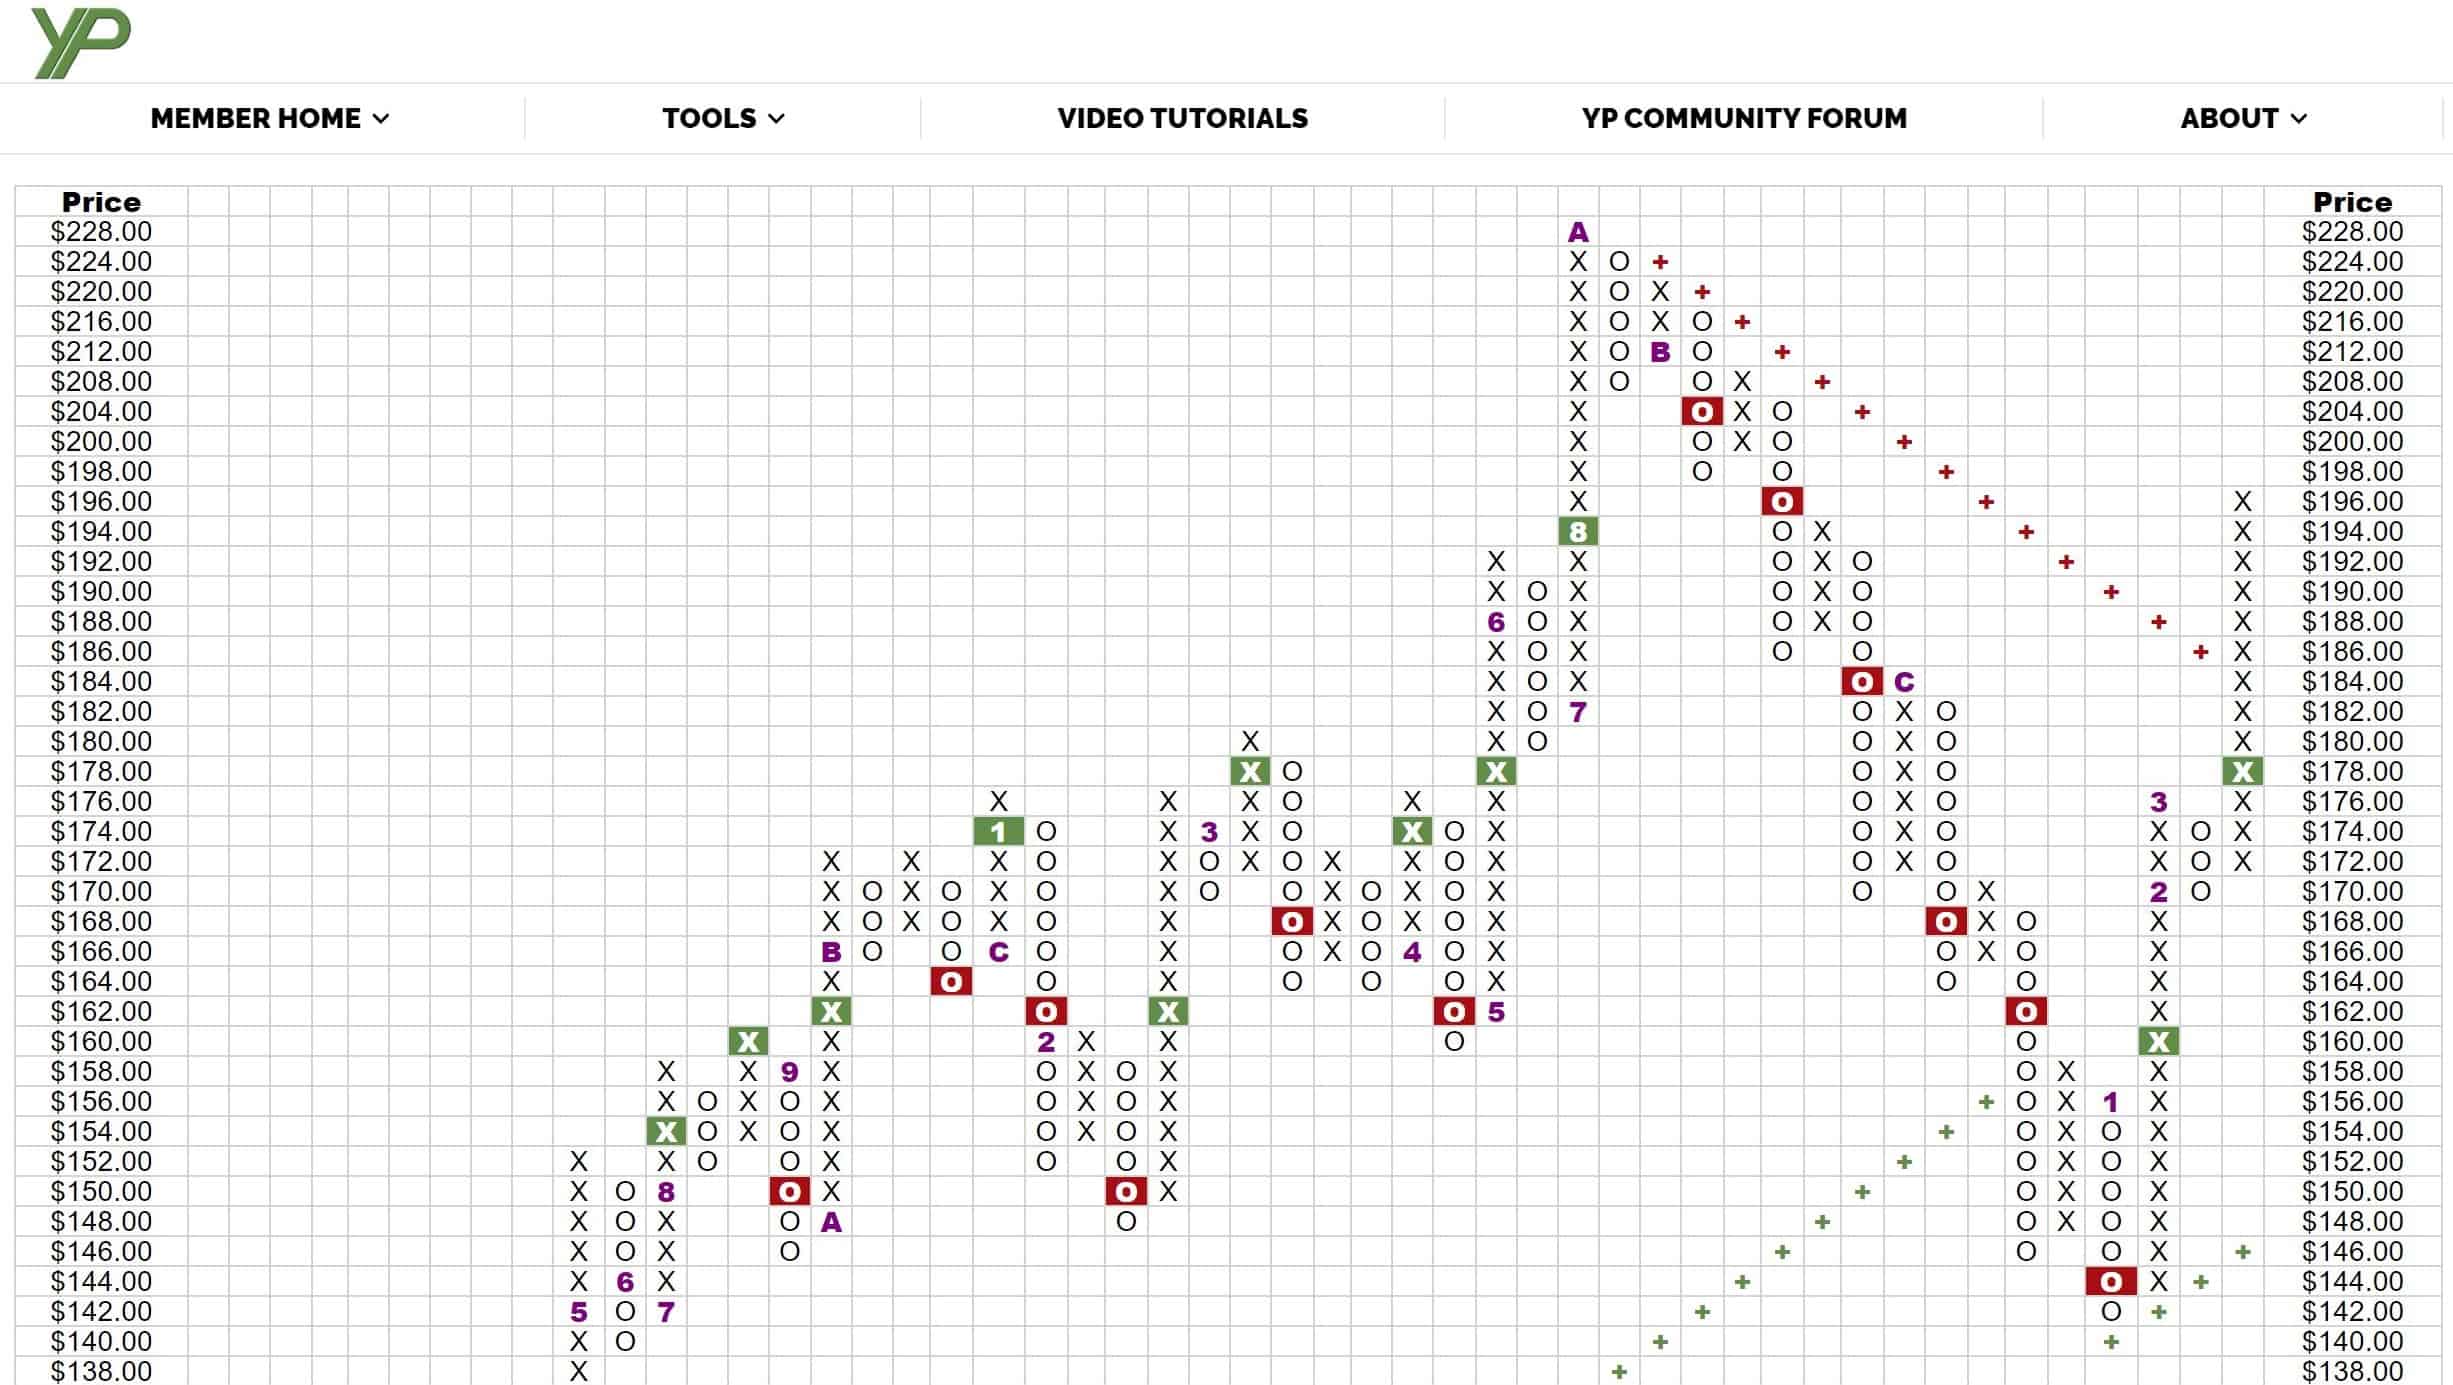
What is a Point and Figure Chart?
One of the foundations to technical analysis is point and figure charting. At YP Investors we have some of the most advanced point and figure charting software. Our charts clearly display key components like buy and sell signals as well as long term trend lines, you will not find a point and figure chart like it. The chart patterns help to determine solid entry and exit points in stock market trading or investing. Watch our Point and Figure Charting Tutorial Video to lean how to use the P&F charts.
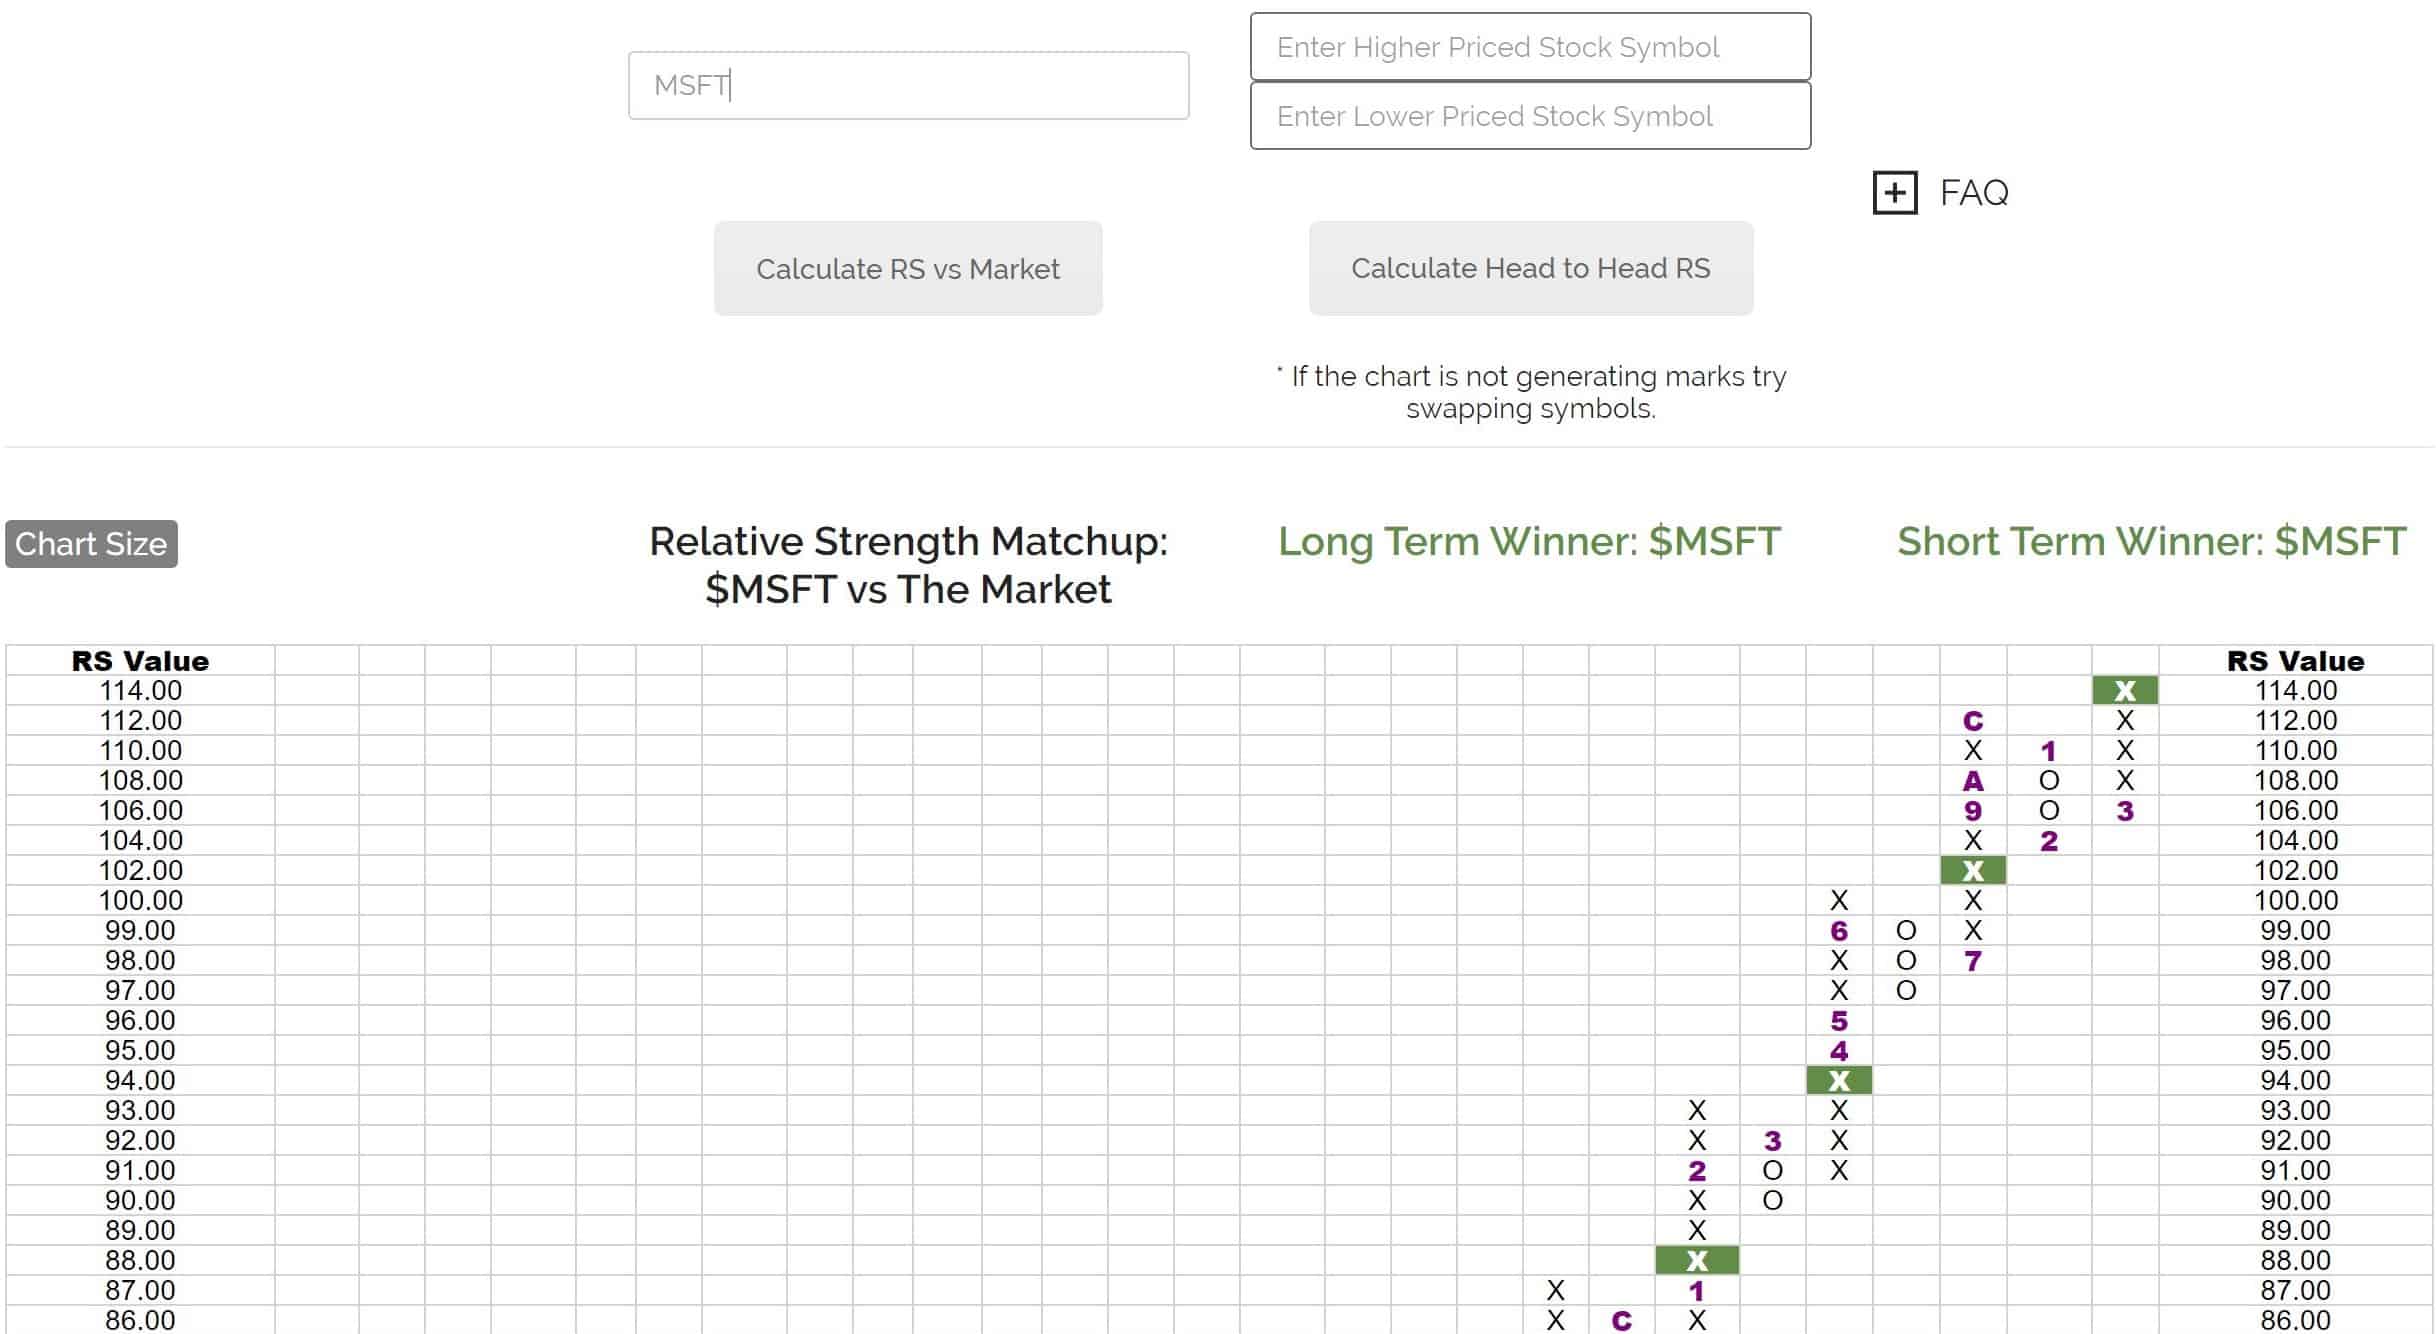
What is Relative Strength?
Relative Strength is a head-to-head comparison of one security to another, and the better performing security wins the battle. At YP Investors we know how to calculate the relative strength of a stock. We plot the stock relative strength chart using point and figure charting. This paints a clear picture and the winner is displayed. You can use our relative strength analysis tool to calculate a stock or ETF relative strength chart which displays the outperforming stock/ETF in a matter of seconds.
What are you waiting for? Join now and start growing your wealth today!
YP Investors Membership Plans
Premium Membership
With YP Investors Premium Membership you get it all! You will gain access to our Exclusive Stock Picks and Sector Rankings, along with Market Condition and Sector Alerts, and all of our Stock Analysis Tools including our powerful Stock Selector Tool as well as our Point and Figure Charts, Relative Strength, and Warren Buffett Fundamentals Tool.
For as little as $25 a month utilize our Stock Analysis Software to help you improve your investments!
Additionally, you will get our most popular free tools, calculators, and pages (forums and investing publications), without the hassle of popups and ads. You will also gain access to our premium help and support on your Member Home page.
Standard Membership
With YP Investors Standard Membership you gain access to our key Stock Analysis Tools including our Point and Figure Chart, Relative Strength, and our one of a kind Warren Buffet Fundamentals Tool. For as little as $16.67 a month utilize our Stock Analysis Software to help you improve your investments!
Additionally, you will get our most popular free tools, calculators, and pages (forums and investing publications), without the hassle of popups and ads. You will also gain access to our premium help and support on your Member Home page.
Basic Membership
With YP Investors Basic Membership you gain full access to our Point and Figure Charts. For just $4.17 a month easily see the long term trend of stocks as well as buy and sell signals that can help you improve your investments and trades!
Additionally, you will get our most popular free tools, calculators, and pages (forums and investing publications), without the hassle of popups and ads. You will also gain access to our premium help and support on your Member Home page.